🏷️Product: Simpler, Smarter Google Analytics Alternative
💸Investment: N/A
💰Revenue: N/A
📊Business model: Subscription based on traffic load.
🛠️Tech stack: React, Laravel with MySQL, Go + NodeJS and PostgreSQL.
🌐Website: https://wireboard.io
🗨️Social pages: 🔗@wireboardio
Hello! Can you tell us a bit about your background and what led you to develop WireBoard?
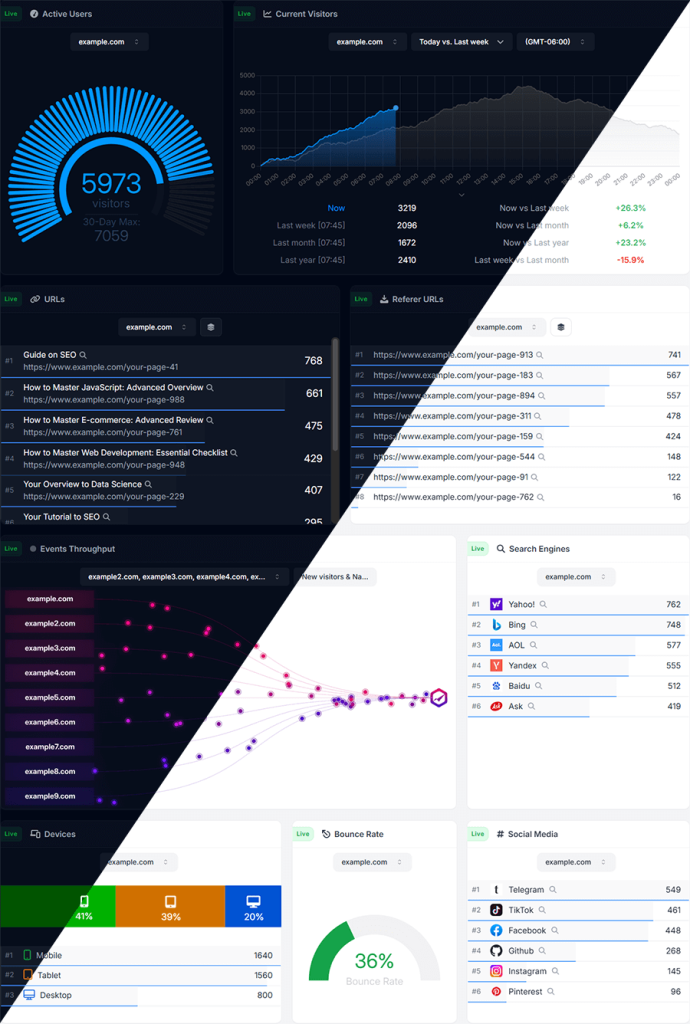
I have a background in computer science as an engineer. As a publisher, I use web analytics every day and needed a tool to see how my websites are performing on a daily basis. For example, I wanted a real-time graph showing the number of visitors currently visiting my 50+ websites, aggregated together, so I could see if my traffic is at the same level as the same day the previous week. Since no one else was doing it, I decided to make it myself and improve web analytics in general.
What gaps did you notice in traditional analytics tools like Google Analytics?
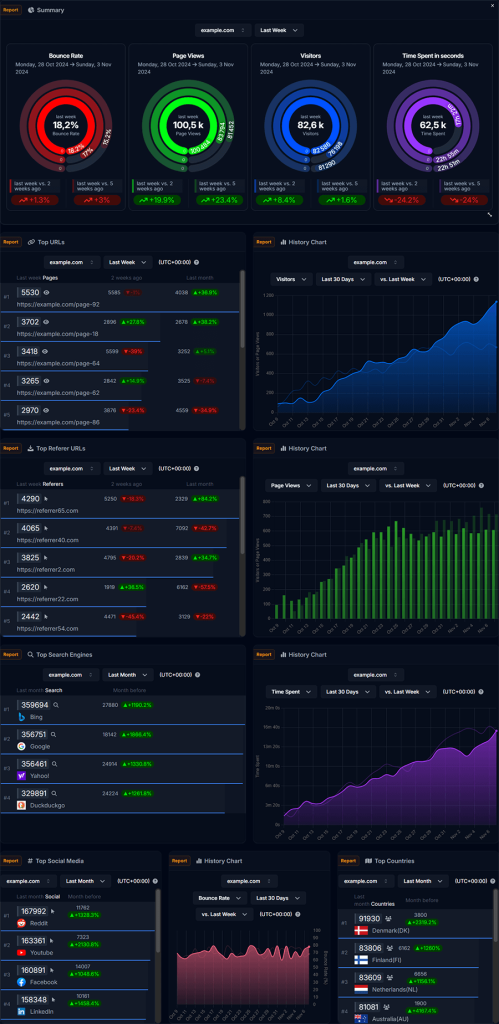
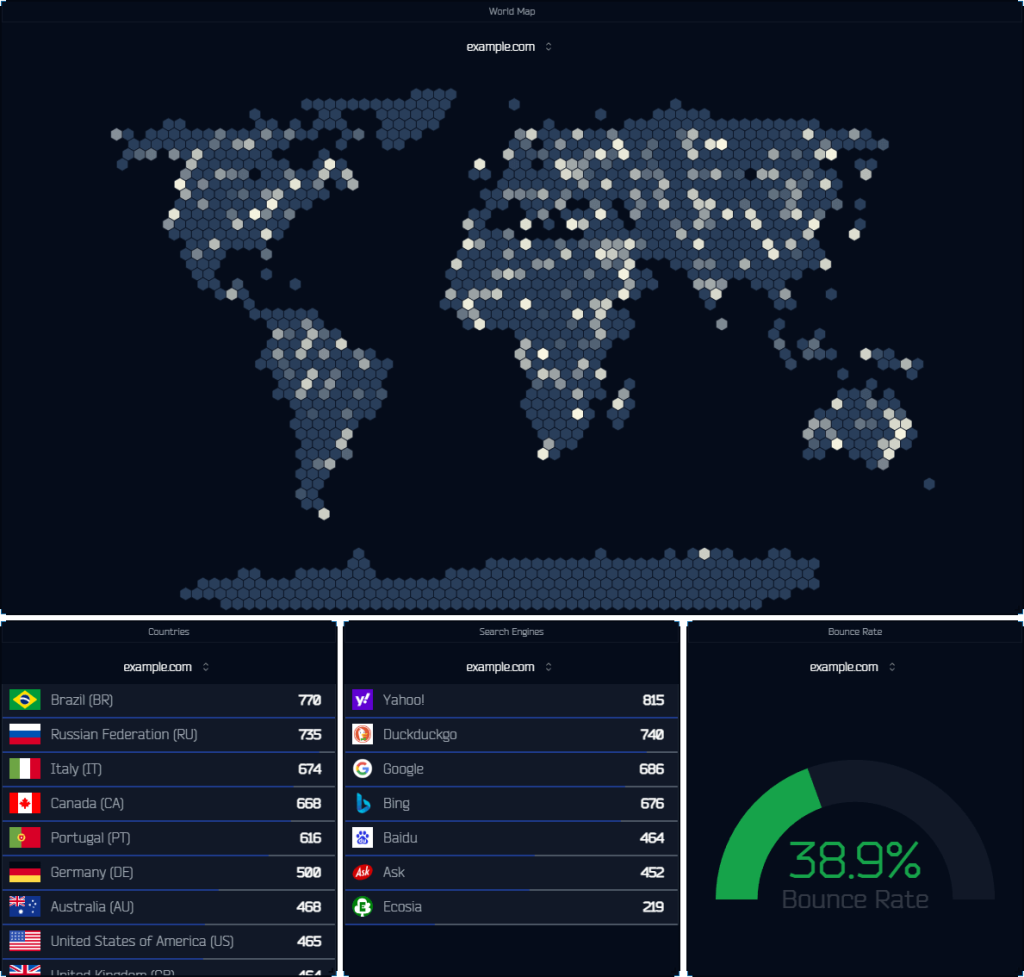
The main gap I noticed was the lack of real-time features, which are critical for a lot of businesses, like news media or content publishers. Also, there’s no real solution for people who own more than one website and want to see all their data in one place. Timezone selection was also important for me, because each website has its own target audience (by country). Finally, the ability to customize the dashboard you’re using was also missing in Google Analytics and most other analytics tools.
How does WireBoard combine reporting and real-time analytics to deliver a simpler, smarter experience? Could you share a specific use case that highlights these features?
I think real-time web analytics is underused. With GA, people are used to seeing their data hours or even days later, then making decisions based on that outdated data. With real-time data, you can understand what is going on and why.
A recent example came from one of my users. He was featured on HackerNews, so he had a surge in traffic and could immediately see that something was happening and why. Real-time data lets you engage with current events and make the most out of it by interacting with people while it’s happening. Combining this with traditional web analytics (reports) is a great way to really use your data.


Analytics tools can sometimes feel complex to set up and interpret. How does WireBoard simplify this experience for non-technical users or smaller businesses?
Setting up WireBoard is simple; it’s just a JS script to add to the website and takes about two minutes. Then the setup is a one-click process with template dashboards that can be customized further if needed. The onboarding experience is designed to be smooth and easy, especially for those looking to leverage real-time web analytics without complex setup.
What future developments or features can users expect from WireBoard? How do you envision the platform evolving over the next year?
More features are on the way, like custom event tracking, AI-driven data analysis, and more. I’m also getting great feedback from specific use cases that could benefit everyone. My goal is to make WireBoard the best product possible and to keep evolving it based on user needs.
Did you enjoy this interview with WireBoard founder? I regularly interview creators who have recently launched their products. Check out additional discussions like this on BetaHunt. For updates, follow me on X.

Leave a Comment